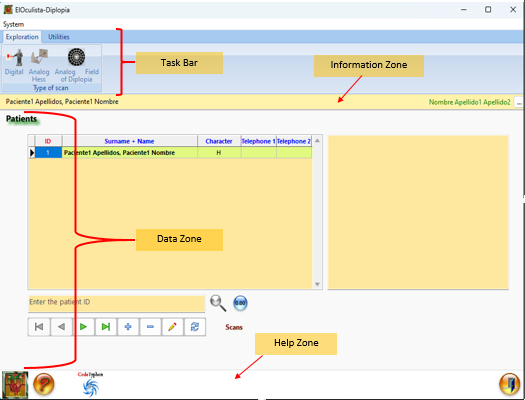
It has been divided into 4 zones, shown in Annex A-01, which from top to bottom are:
· Taskbar.
The task bar has 2 tabs. One with the type of scan to choose: digital Hess, analogue Hess or diplopia field. The other one allows you to access the system configuration, modify the interface environment and print some documents directly.
· Information area.
On the left side, the selected patient is displayed, while on the right side, the selected doctor and a button to change the doctor responsible for the examination are displayed.
· Data area.
This is the most important and largest area. The screens associated with each action appear here. By default, when the application is launched, an editable list of patients appears. It is essential for a patient to have his or her file to be able to access the exploration.
Therefore, the following tabs appear here:
- List of patients. It allows the total management of the patients' records. Therefore, any record can be inserted, deleted, edited and located. The list can be ordered alphabetically by surname, history number or telephone number. Once the record has been created, the Examination Data screen can be accessed. This tab is shown in Annex A-02.
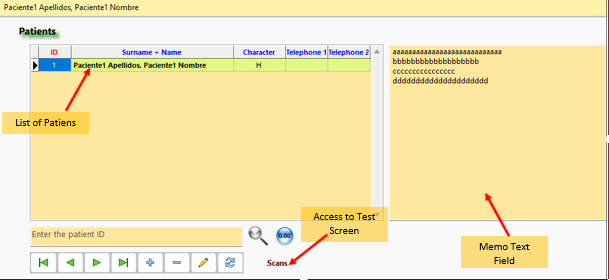
§ Exploration Data. The following elements are available here:
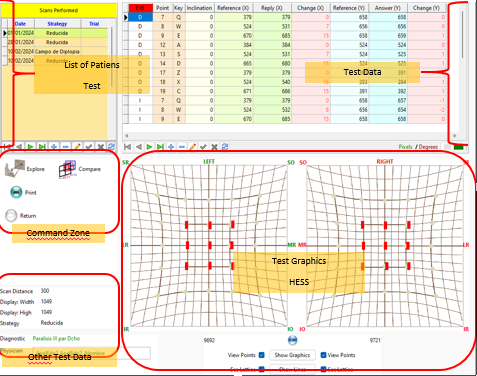
o List of scans performed on each patient. It is possible to add, edit or delete scans. Depending on the strategy chosen for the test, some elements will be visible and others will not. Although the design is similar, in the case of a Hess test, the Compare tests button will be available, whereas in the case of a diplopia field, this button will not be available.
o Access buttons to the scan screen and to the scan comparison tab (if it is a Hess test) and to the printing system (Annex I-04 and Annex I-05). These can only be accessed if a scan previously exists or has been added. It is possible to modify an existing scan.
o Information panel of the test parameters: scan distance, width and height of the screen used, strategy, presumptive diagnosis and responsible physician.
o "Hess" tab:
o List with data of the scan performed or the selected scan. They include the specific point, the associated key, the torsion if it exists, the location of the projected point and that of the point responded to by the patient, the difference between the two, and this on both the vertical and horizontal axes. Since the position of each eye is symmetrical, the differences are relative to the point itself, taking into account whether the response does not reach or exceeds the point presented. In this way the 2 eyes can be compared. The data can be represented in pixels or in degrees.
o Graphs representing the response of each eye. There is one for each eye. The arrangement is as if the patient is looking at the graphs. Thus, the right eye chart is on the right and the left eye chart is on the left. On them the patient's response can be seen as small red rectangles. The position of these rectangles is proportional to the data obtained in the test. In addition, the lines connecting these responses can be drawn automatically. The union of these lines forms a parallelogram whose surface is automatically calculated and indicates the number of pixels contained in this parallelogram. This is another parameter that allows the different scans to be tracked.
o Buttons for manipulating the plots, such as initialising the plots, displaying the plots, displaying the lines and the possibility to hide or show the displayed points and the lattice. All this in each eye separately.
o "Compare Tests" tab (Hess)
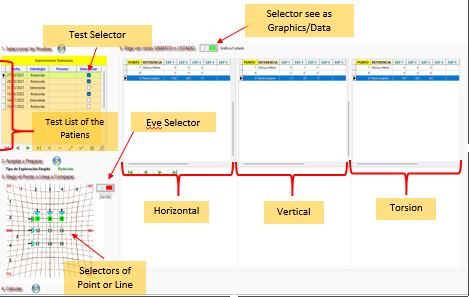
This tab is designed to follow a specific sequence of steps that allow us to compare the evolution of several tests. Following this criterion we have:
o A list of the tests performed on the patient. The list includes the date when the test was performed, the type of test and a button to select or not that test. It should be noted that all tests selected must have been performed with the same strategy. In other words, only tests that have been performed with the same strategy can be compared.
o Button to accept the selection and prepare the data. If the selected tests have not been performed with the same strategy, an error message appears.
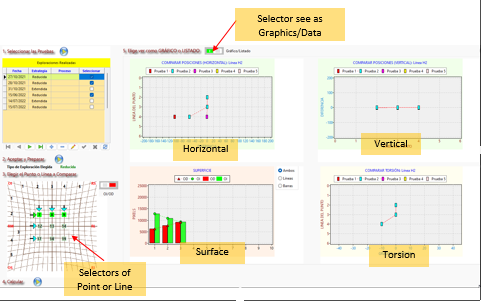
o Graph with eye, line or point selectors. A Hess plot is displayed with the points of both the extended and the reduced test. The points are numbered from left to right and from top to bottom from 1 to 25. The points corresponding to the extended test have a bluish background, while the points of the reduced test have a more greenish background. When clicked, their background changes to green to indicate that the point is already selected.
There are indicators of the position of each muscle, which adapts to the scanned eye in both location and reference colour.
Eye selection button, which adjusts the position indicators of each muscle.
In addition, there are horizontal and vertical arrows, 1 for each row or column that make up the rows. There are therefore 5 vertical and 5 horizontal arrows in the extended test, while in the reduced test there are 3 vertical and 3 horizontal arrows. The arrow, when pressed, selects the points corresponding to that row, changing its background colour to green.
o Button to calculate the data.
The differences between the position of the token and the position of the patient's response are calculated and displayed. These differences can be negative (indicating hypofunction) or positive (indicating hyperfunction). The differences have been delimited between -200 and +200 pixels of difference, sufficient to represent any alteration.
o Selector to choose between numerical or graphical presentation of the comparison data.
o Numerical representation (list):
There are 3 listings that allow to compare:
- The evolution of the horizontal position.
- The evolution of the vertical position.
- The evolution of the torsion, if any.
All three provide the following information:
- The number of the selected point.
- The muscle reference, if any, to which this point corresponds.
- The data of up to 5 examinations ordered by date of performance (from the most distant to the most recent).
There will be as many lines in the list as points selected, with a maximum of 5 (which are the points that make up a row or column in the extended scan).
o Graphical representation:
Four graphs have been designed to compare each one separately:
- The Horizontal position.
- The vertical position.
- The torsion, if any.
- The surface of the parallelogram formed by the responses of each scan.
The graph to compare the horizontal position has the following characteristics:
- The header shows the color assigned to each scan (maximum 5) and the point or line scanned. Red test 1, blue test 2, pink test 3, yellow test 4 and orange test 5.
- The x-axis shows the difference of the positions. Its value is bounded between -200 and +200. 0 means that there is no difference.
- The ordinate axis shows the line corresponding to the scanned point. Its values range from 0 to 6 in order to match the selector plot, therefore, only lines 1 to 5 will be represented. For example, if I want to compare point 7, the data will appear on line 2, if I want to compare point 21, its data will appear on line 5. When choosing complete lines of points in case of reduced scanning, lines 2, 3 and 4 are used, while in case of extended scanning, lines 1, 2, 3, 4 and 5 are used.
The graph for comparing the vertical position has the following characteristics:
- The header shows the color assigned to each scan (maximum 5) and the scanned point or line.
- The abscissa axis shows the line corresponding to the scanned point. Its values range from 0 to 6 so that there is coincidence with the selector chart, therefore, only lines 1 to 5 will be represented.
- The ordinate axis shows the difference of the positions. Its value is bounded between -200 and +200. 0 means that there is no difference.
The graph for torsion comparison has the following characteristics:
- The header shows the color assigned to each scan (maximum 5) and the scanned point or line.
- The abscissa axis shows the value of the torsion. Its value is bounded between -40 and +40. 0 means that there is no torsion.
- The ordinate axis shows the line corresponding to the scanned point. Its values range from 0 to 6 to coincide with the selector plot, therefore, only lines 1 to 5 will be represented.
The graph for surface comparison has the following features:
- A selector to display a bar diagram, a line diagram, or both.
- The header shows which diagram is displayed and the color assigned to each eye.
- The abscissa axis indicates the selected scans (maximum 10).
- The ordinate axis indicates the area in square pixels, its value being bounded between 0 and 25000.
o “Diplopia Field” Tab:
o List with the data of the performed or selected scan. They include the line number, the corresponding activation key, the X position of the left edge of the gaze field, the binocular field and the diplopia field, the X position of the right edge of the diplopia field, the binocular field and the gaze field, the Y position of the left and right edge of the different fields. Each group has its specific color so that they can be distinguished with just a glance.
o Graph that represents the patient's response. In it, each group of responses is visualized with its corresponding color: Field of gaze in green, binocular in blue and diplopia in red.
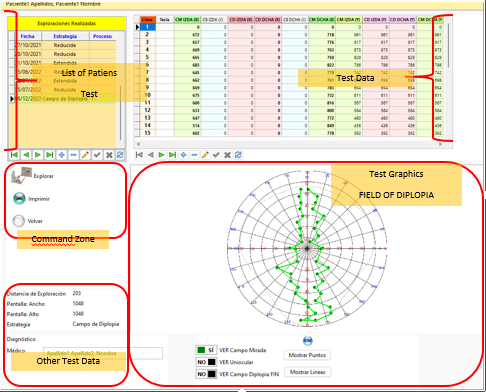
o Buttons to manipulate the graph, such as initializing the graph, showing the answered points, showing the line that joins the points of each group and selectors that allow hiding or viewing a certain group of points.
Annexes A-03, A-04 and A-05 show the design of the different tabs.
- System configuration tab. It allows to adapt the program to our physical environment. We can perform the following tasks:
o Indicate if we have only 1 monitor or there is another monitor... secondary.
o Enter the size of the monitor that we use.
o Obtain automatically the resolution of the graphics system.
o Obtain the pixels/millimeter according to the size and resolution of the monitor.
o Change the background color of the Hess scanning screen.
o Display by default the grid of the scanning screen.
o Access the window for setting the size of the scanning screen.
o Access the tab for setting the background color of the screen and the color and size of the Hess-Lancaster screen cores.
o The color can be modified in two ways: with a color palette or with the RGB model.
o Obtain the scanning distance for the diplopia field study that allows a minimum of 70º of extension from the center.
o Change the shape and size of the token used to study the diplopia field.
o Obtain the scanning distance of the diplopia field, as well as set the default size and shape of the token.
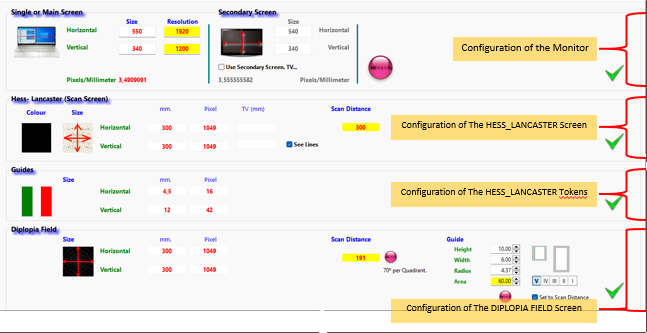
The design of the system configuration screen is shown in Annex A-06.
§ Doctors tab.
In this tab you can enter, modify and delete the Physician's cards. The active physician can also be selected.
En el Anexo A-07 se muestra el diseño de la pestaña Médicos.
· Lower Zone.
Here you will find the buttons to access:
o The author's data.
o The help.
o The logo of Codetyphon, the IDE in which the program is written, compiled, debugged and linked, a requirement to be able to distribute it freely.
