It is accessed by selecting a patient and pressing the "Exams" button.
The screen is divided into several sections:
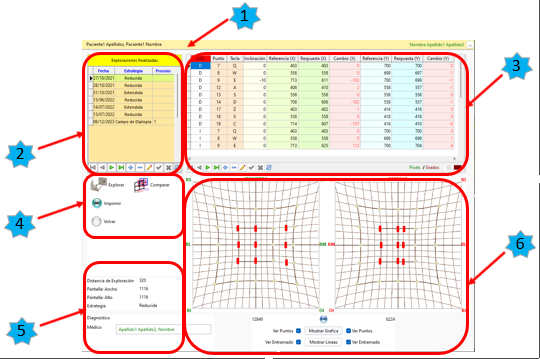
1. Message area, orange (1).
On the left appears the name of the active patient.
On the right the name of the active doctor and a button to change doctors.
- Exploration List (2).
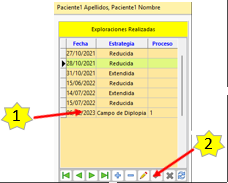
It is located to the left and above. We have:
The list of scans carried out in itself (1).
The data available are the date of the test, the type of test and the process. It is sorted by date.
Selecting a column automatically displays the test data.
The navigator (2). The navigator allows adding, editing, deleting and selecting through the different scans of the active patient.
- Numerical data of the indicated exploration (3).
The list below depends on the type of exploration:
· Hess, Hess-Lancaster test
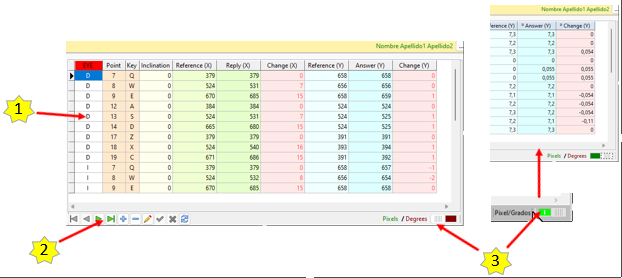
It consists of:
A list (1) showing the examined eye (1 = Right, 2 = Left), the point examined, whether the patient has rotated the witness (inclination), the horizontal position (X) of the witness and the position of response, the difference between both data, the vertical position (Y) of the witness and the position of the response, as well as the difference between both.
A browser (2) that allows you to add, edit and delete points. You can also access the point you want.
This option should only be used to round the data if there is any.
To edit a data, press the “Edit” button in the Navigator and then the cell that you want to change. To make the change effective, the “Accept” button on the Browser must be pressed.
Switch Pixel/Degrees (3).
It allows to visualize the data of the exploration in Pixels or in degrees. With this last option the degrees are adjusted to the scan distance, this way they can be comparable at different scan distances.
· Diplopia Field Test
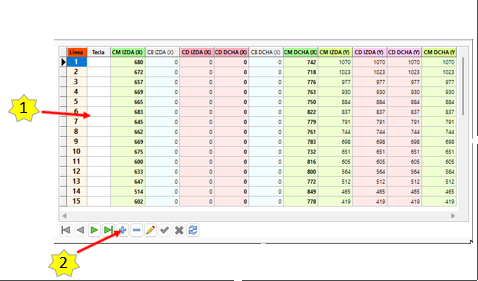
It consists of:
A list (1) showing:
<![if !supportLists]>o <![endif]>The scanned line number.
<![if !supportLists]>o <![endif]>The key associated with the point, if applicable.
<![if !supportLists]>o <![endif]>The scan data.
They are grouped according to the horizontal and vertical response. In addition, the response of the gaze field is shown on a green background, that of the uniocular field on a blue background and that of the diplopia field on a red background.
A navigator (2) allows you to add, edit and delete points. The desired point can also be accessed.
This option should only be used to round off the data if necessary.
To edit a piece of data, click on the "Edit" button of the navigator and then on the cell to be changed. To make the change effective, click on the "Accept" button of the Navigator.
- Command Buttons (4).
The buttons available depend on the type of test.

Explore button (1).
Pressing it you access the exploration screen.
“Print” button (2).
By pressing it you access the preview screen of the test.
Back" button (3).
Pressing it takes you to the main screen with the list of patients.
Compare" button (4).
This button is only available if the scanning strategy is the reduced or extended scanning strategy, i.e. in the Hess test. Scans of the diplopia field cannot be compared.
- General exploration data (5).
The data in which the exploration has been developed are available in the lower and left area of this screen.
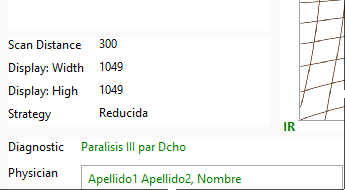
You can see:
The Scan Distance used.
The width of the screen used.
The height of the screen used.
The exploration strategy (Reduced or extended).
The diagnosis.
The physician assigned to the patient.
- Scan graphs (6).
The elements depend on the type of exploration:
· Hess, Hess-Lancaster Test
There is a chart for each eye.
Remember that they should be interpreted as if the patient were looking at them. Therefore, the graph of the right eye must be on the right and that of the left eye must be on the left:
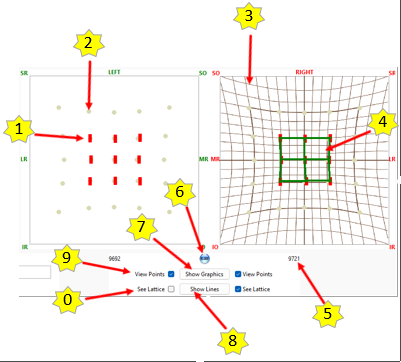
Patient responses (1).
They are red rectangles, 9 for the reduced scan and 25 for the extended scan. Each time we select a scan, their positions are updated to reflect the data.
Reference points (2).
They are grayish circles that indicate the usual scanning points.
Background or framework (3).
It is the layout of the Hess screen, proportional to the graph box.
Lines (4).
They are the lines that join the centers of the patient's responses. They are green.
Surface of the polygon formed by the patient's answers (5).
The program calculates the surface of said polygon in pixels.
“Initialize” button (6).
When pressed, the elements of the graph are no longer displayed, except for the grid, which remains visible.
“Show Graph” button (7).
Response rectangles are displayed.
“Show Lines” button (8).
Lines are drawn, colored green.
“View Points” selector (9).
Makes the usual scan points visible or invisible.
“View Lattice” selector (0).
Make Hess screen lattice visible or not.
· Diplopia Field Test
There is a chart for both eyes.
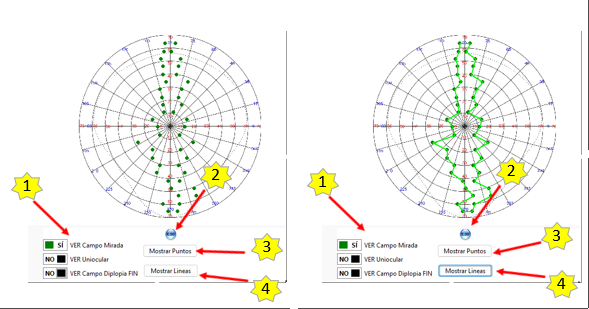
It has the following elements:
Graph itself.
Selectors to see the type of exploration carried out (1):
Field of view. The dots are green.
Uniocular field. The dots are blue.
Diplopia field. The dots are coloured red.
Button "Initialise" (2).
When pressed, the elements of the graph are no longer displayed, except for the lattice, which remains visible.
Button "Show Dots" (3).
The dots indicating the patient's response are displayed.
Show Lines" button (4).
A line is drawn connecting all points. The colour of the line corresponds to the colour corresponding to the type of scan performed.
